Gold Fit to Pull Back a Bit
 share
share
 share
share
 share
share
 share
share
 share
share
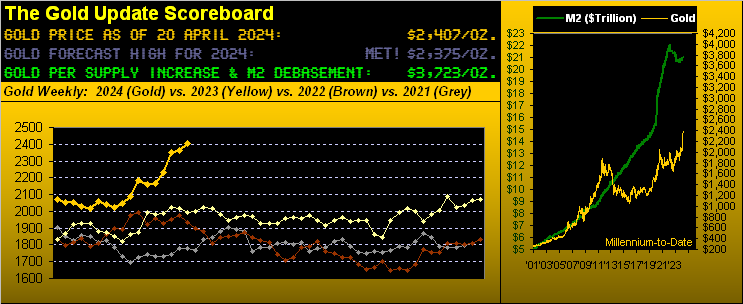
Two missives back we penned “Gold ‘Overbought’ is Great!” and so ’tis been. These past couple of months have finally seen a long overdue repricing of Gold from some three years of being range-bound in the 1700-2000 zone to now up through our forecast high for this year of 2375 and onward to a new All-Time High at 2449 recorded just over a week ago (on 12 April).
And yet whilst championing this latest ascent, we’ve warily pointed throughout the extent to which Gold has become technically stretched such that we “know” retrenchment is to be expected. And we say that with 100% respect due the opening Gold Scoreboard’s Dollar debasement valuation of 3723, given price settling this past week yesterday (Friday) at “only” 2407, itself an All-Time Weekly Closing High. Yet to repeat that from a week ago: “…near-term Gold is very over-extended; but broad-term Gold remains very undervalued…” We can’t quintessentially put it any better than that.
‘Course a key metric we regularly watch as is the case for all five components which comprise the primary BEGOS Markets, (Bond / Euro / Gold / Oil / S&P 500) is Gold’s smooth valuation line which specifies a near-term value based on price’s day-to-day movement relative to the other four BEGOS components. (The website’s Market Values page displays same for all five markets). Indeed invariably through a generation (which for you WestPalmBeachers down there is 25 years) of calculating Market Values, ’tis axiomatic that price and valuation regularly re-meet. And per the following left-hand panel of Gold’s daily closes from three months ago-to-date vis-à-vis the smooth valuation line, price at present (per the difference of price less value) is right now +195 points “too high”. (The right-hand panel is the same drill for the S&P 500, near-term oversold, but upon which we’ll later expound):

Still therein for the yellow metal, the good news is the smooth valuation line itself is rising such that price need not actually drop -195 points; (the pace of the smooth line’s ascent exceeded +5 points every day last week). Regardless: price (2407) remains sufficiently high above value (2212). On a percentage basis that is a +8.8% gap: the last period of such upside percentage excess was during the onset of the RUS/UKR incursion during early March 2022, following which within the ensuing 10 weeks Gold fell better than -200 points. And to the extent Gold’s recent buoyancy is arguably due to fresh Middle East conflict, we’ve herein demonstrated over the years that geo-political price spikes for the yellow metal are short-lived. Further, as the website’s Market Values page is a bona fide leading indicator of direction, even as Gold of late has been getting the bid, again we remain wary of price having reached a near-term lid.
Too from the technical tent, Gold by its “continuous futures contract” is approaching a flip of the daily parabolic measure from Long to Short: currently 2407, were 2386 to trade on Monday, such Short (albeit a bad idea) would be in play; and Gold’s average price decline across the past 12 such Short signals is -353 points (just in case you’re scoring at home). But no, we do not expect anything of such downside magnitude this next time ’round.
‘Course, all this near-term negative awareness may be moot given the International Monetary Fund having stated this past week that “Something will have to give” with respect to what is deemed as an unsustainable level of U.S. debt and thereto its global fallout ramifications. “Got Gold?” Again, despite price’s record highs, fundamentally ’tis still cheap and it looks great:

“And I added a lavendar-bounded support area in there, mmb…“
Nicely done, Squire, in that view of Gold’s weekly bars from a year ago-to-date. And we concur: your 2150-to-2000 area does look structurally-supportive for Gold, and notably enhances the notion that the sub-2000 days are gone. Indeed should near-term price weakness come to the fore, that year-over-year graphic really encompasses Gold’s soar. And ultimately, we’ll see more.
Now having just mentioned the IMF, ’tis a nice segue into the StateSide Economic Barometer. For with respect to the U.S. economy, the IMF also penned on Tuesday: “The exceptional recent performance of the United States is certainly impressive and a major driver of global growth…” We cite as well their chief economist Pierre-Olivier Gourinchas: “The strong recent performance of the United States reflects robust productivity and employment growth, but also strong demand in an economy that remains overheated…” Is that your takeaway per the Econ Baro from a year ago-to-date? Is the economy really that great? Or shall it stagflate as we’ve suggested is its state of late?

Last week brought 13 metrics into the Baro: but period-over-period, just four improved. Moreover, ’tis Q1 Earnings Season: thus far for S&P 500 constituents, 51 have reported with just 30 having increased their bottom lines from a year ago. But this is the mighty “best of the best” S&P 500: should not all entities therein be improving; (a bit tongue-in-cheek perhaps, but to be fair, in a decent Earnings Season at least 70% improvement at the S&P level ought be expected; thus far just 59% have made more money, albeit ’tis early).
However, even as the aforeshown green Market Values graphic of the S&P shows its futures as sufficiently oversold, the truth remains that earnings are not supportive of price: the “live” price earnings ratio of the S&P settled yesterday at 43.1x. Reprise yet again one Jerome B. Cohen: “…in bull markets the average [P/E] level would be about 15 to 18 times earnings.” Recall our notion in recent years of a “Look Ma, no earnings!” crash?
Or if you prefer more lately, a “Look Ma, no money!” crash? The current market-capitalization of the “Casino 500” now at $43.3T is just 48% supported by the liquid U.S. money supply (M2 basis) of only $21.0T. So when you sell, how’s your broker’s “I.O.U.” gonna work out for ya? Nuff said.
And yet has enough been said by the Fed? No. For on the heels of former TreasSec Larry “Oh Not That Guy” Summers in the week prior having cautioned the Federal Reserve’s next rate move could possibly be up rather than down, just this past Thursday at the Semafor World Economy Summit, New York FedPrez John “It’s All Good” Williams said: “…if the data are telling us that we would need higher interest rates to achieve our goals, then we would obviously want to do that…” Obviously indeed. You regular readers know we’ve been musing well ahead of the curve about rate hike(s) since our first missive of this year. And ’tis been better than 30 years since upon pushing Barbie’s button she said “Math class is tough.” As we oft harp, these days it seems no one does math; rather, they parrot. “Well, it was on the news, ya know…”
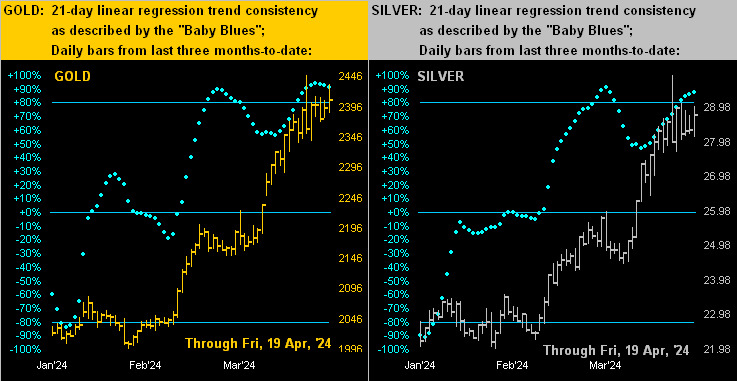
Yet hardly can enough be said about the precious metals having run ahead, both Gold and Silver as thoroughbreds! In fact amongst the entire BEGOS pack, Silver now leads the year-to-date percentage tracks at +19.6%, followed by Oil +16.7% and then closely by Gold +16.2%. (The S&P’s once-inane gain has now fizzled to just +4.1%; we’ll display the whole bunch in next week’s “month-end” edition of the Gold Update).
But specific to Gold below on the left and Silver on the right, historically one is hard-pressed to find such like uptrend performance. Why, even the “Baby Blues” of trend consistency having fallen a month ago below their key +80% axis could not forestall further price-rise by any material degree. Still: that +80% level is critical to watch, for upon being breached, the rule rather than the exception is lower price levels near-term; (the “Baby Blues” you can find updated daily, ‘natch, on the website):
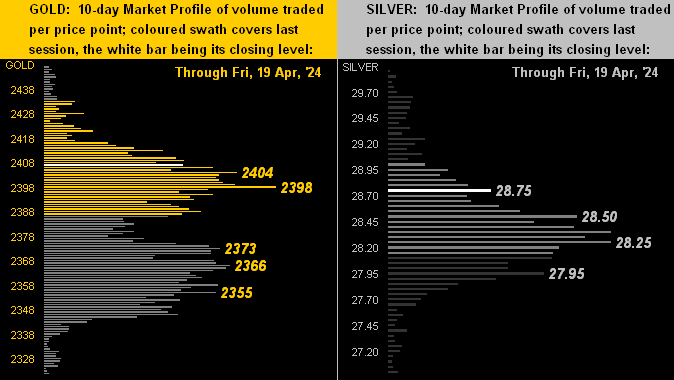
Turning to the 10-day Market Profiles for the precious metals, you also can clearly see the bulk of trading for both Gold (at left) and Silver (at right) as centered in their respective price stacks. The most dominant prices therein traded are as denoted:
Next week bring 10 metrics into the Econ Baro, the two most viewed to be:
- The first peek at Q1 Gross Domestic Product, the growth pace for which is expected to have slowed from that in Q4, and
- March’s “Fed-favoured” Personal Consumption Expenditures Prices, such paces not expected to have eased from those in February.
Nonetheless, despite a pending dip in the price of Gold, ‘tis best you continue to grab more and hold!

Cheers!
…m…
www.TheGoldUpdate.com
www.deMeadville.com
and now on “X”: @deMeadvillePro
********
share
share
share
share
share

Mark Mead Baillie has had an extensive business career beginning in banking and financial services for two years with Banque Nationale de Paris to corporate research for three years at Barclays Bank and then for six years as an analyst and corporate lender with Société Générale.
For the last 22 years he has expanded his financial expertise by creating his own financial services company, de Meadville International, which comprehensively follows his BEGOS complex of markets (Bond/Euro/Gold/Oil/S&P) and the trading of the futures therein. He is recognized within the financial community of demonstrating creative technical skills that surpass industry standards toward making highly informed market assessments and his work is featured in Merrill Lynch Wealth Management client presentations. He has adapted such skills into becoming the popular author each week of the prolific “The Gold Update” and is known in the financial website community as “mmb” and “deMeadville”.
Mr. Baillie holds a BS in Business from the University of Southern California and an MBA in Finance from Golden Gate University.